
Amplify market returns while seeking tax savings

Long short direct indexing—a strategy exclusively
offered by hedge funds now available to everyone.
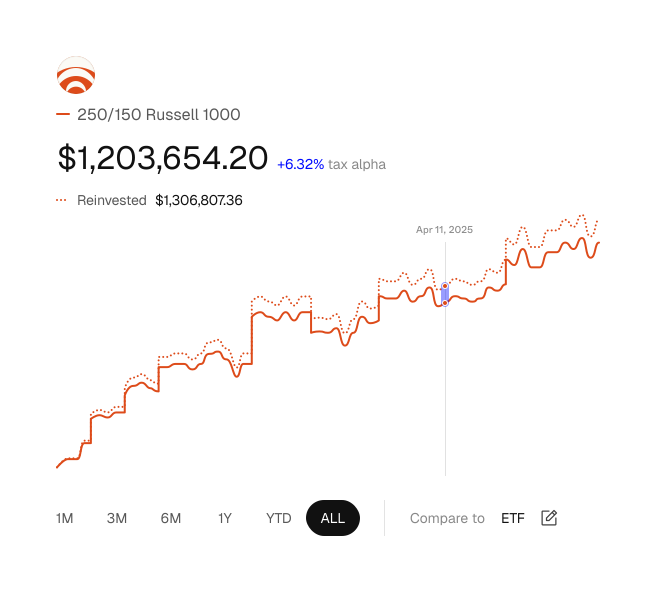
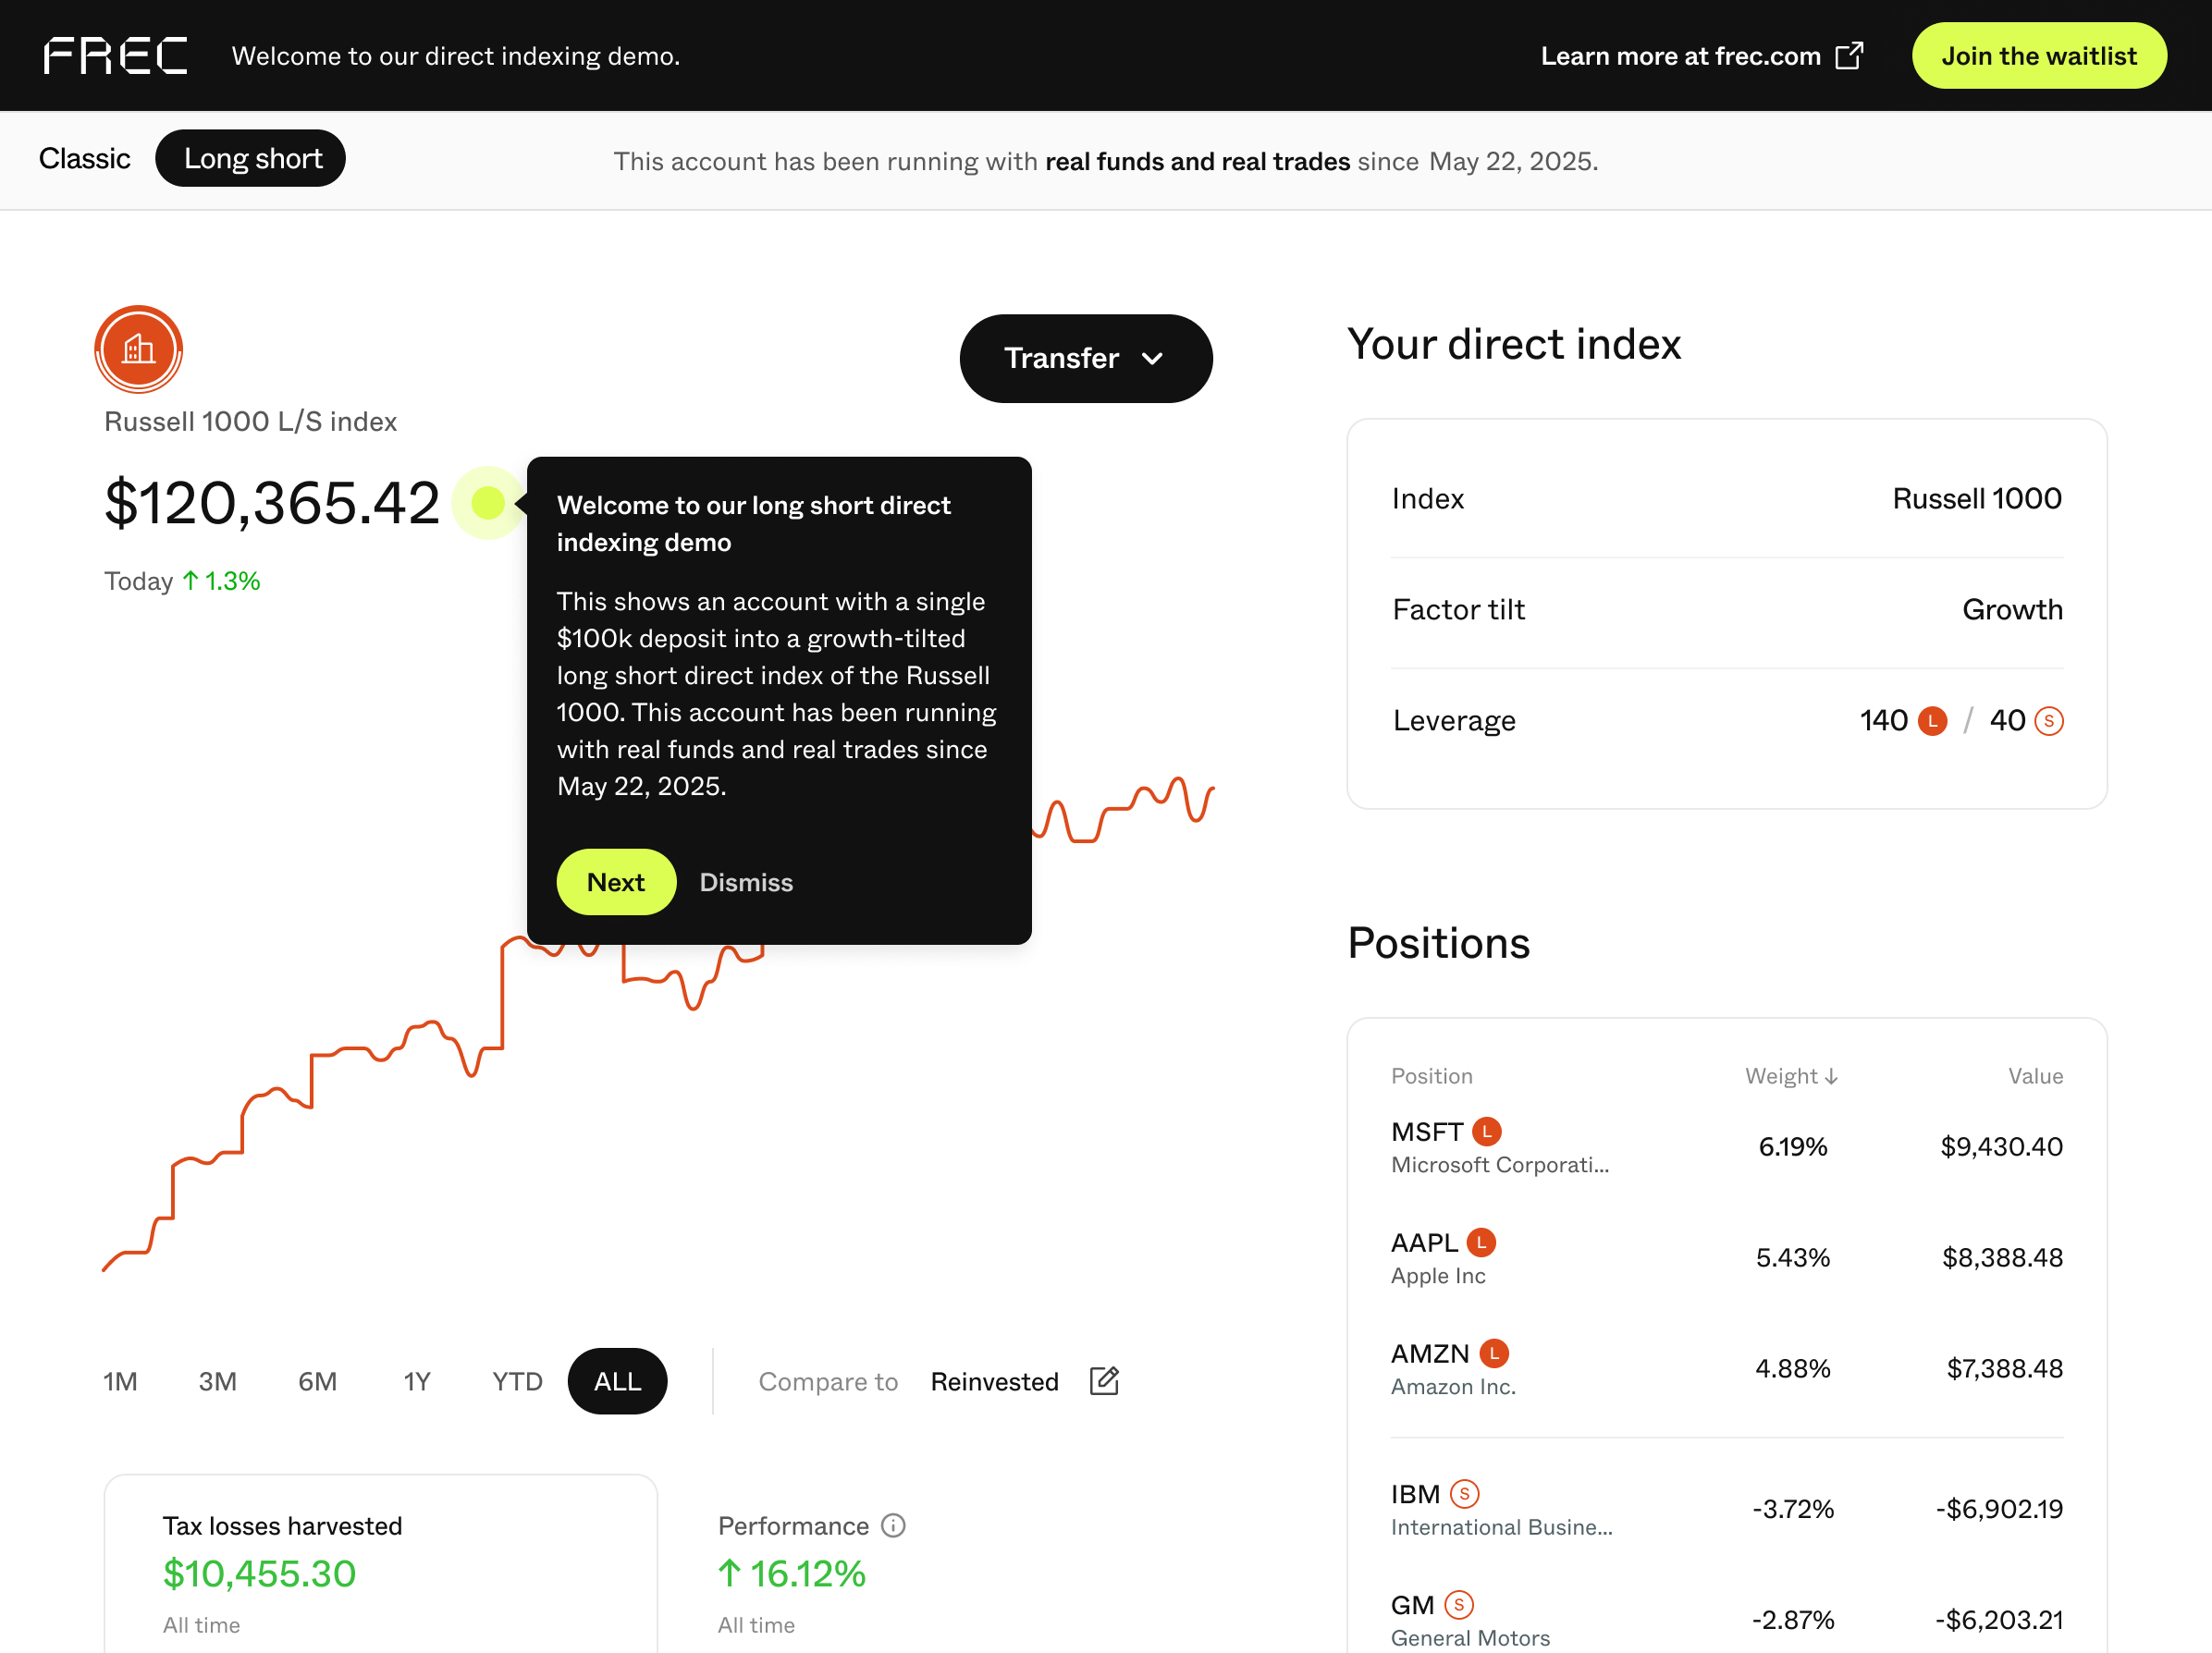
Screenshot of Frec's direct indexing home page
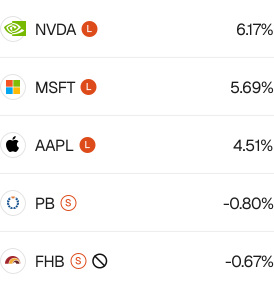
Screenshot of Frec's direct indexing positions page

Amplified returns

Simulations show potential excess return of up to 8.49%1 through factor tilting and harvesting losses.

Low minimums

Get started with as low as $100k, compared to $1m minimums with hedge funds.

No human advisor needed

Save 1% on advisor fees and have all of the visibility and control over your portfolio.

How does long short direct indexing work?

Tilt your portfolio,
harvest more losses

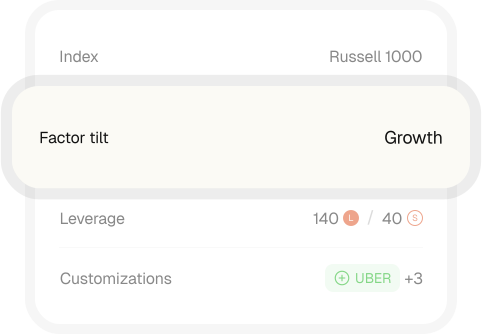
With a long short direct index, you can choose a factor tilt to pursue potential excess returns while still tracking your benchmark index.
Long short vs Classic direct indexing

How does long short direct indexing differ from classic, long-only direct indexing?

Frec

Long short direct indexing

Frec

Classic direct indexing


Tax losses harvested

as a % of your initial investment over 10 years2

130%-337%

Up to 40%


Pre-tax alpha

Supported
Not supported

Annual fee

0.50%-1.30%

plus 0.23%-0.86% post-tax financing costs*

0.09%-0.35%


Minimum investment

$100k-$500k

$20k-$50k
*Post-tax financing cost is gross financing cost minus tax deductions from financing expenses using a 40% marginal tax rate. Actual after-tax costs depend on individual tax circumstances, consult your tax advisor. As a percentage of total assets, pre-tax financing cost is 0.38% for 140/40, 0.95% for 200/100, and 1.425% for 250/150.

Available now

Explore all strategies

See how Frec works

Interactive demo
Experience it
Get a live demo
Schedule your demo

FAQs

Help center
Access long short today.

We support individual, joint, trust and business accounts.

Want to speak to a human?
We're here to help.

Check the background of Frec Securities LLC on FINRA's BrokerCheck. Questions? Reach out to us at help@frec.com.

1

The 8.49% long short data point reflects the after-tax excess return for our highest-performing long short direct index (250/150 of the Russell 1000 with a Quality factor tilt). The after-tax excess return represents the annualized value of each strategy's annual performance after considering the tax-loss benefit. Other factor tilts result in lower data point values; all results can be viewed in our white paper. Results are based on a one-time $1 million investment into each strategy, with each number obtained separately from the average of 41 simulation runs between 04/01/2005 and 02/13/2025. The tax-loss benefit component assumes that investors have sufficient capital gains in each year to fully utilize harvested losses. The calculation assumes a blended short-term tax rate of 42.3% and a long-term tax rate of 28.1%, and includes AUM fees, transaction costs, and/or financing costs; total fees are 0.22% for long-only and 2.725% for the 250/150 strategy with Quality tilt. Investors whose capital gains are insufficient to absorb harvested losses, or who are subject to different tax rates, will experience lower after-tax excess returns. This figure should not be relied upon as an estimate of any specific investor's expected tax savings. The results are hypothetical, do not reflect actual investment results, and are not a guarantee of future results.

2

The tax losses harvested as a % of your initial investment over 10 years results are based on historical simulations of Frec's 140/40 long short portfolio with a value factor tilt, benchmarked to the Russell 1000 as compared to the S&P 500 long only strategy. There were 36 simulations run between 12/2003-06/2022 for the S&P 500 with a one-time $50,000 investment and included a 0.10% fee, while there were 41 simulations run between 04/2005-02/2025 for the 140/40 strategy with a one-time $1m investment and included a 1.0% fee. The results are hypothetical, do not reflect actual investment results, and are not a guarantee of future results.

Testimonials may not be representative of the experience of other customers, there is no guarantee of future performance or success, and all are current Frec customers and were not paid for these statements.

Frec is making sophisticated investing strategies simple and accessible. By using frec.com, you accept our Terms of Use and Privacy Policy. Frec is only available to US residents. Frec refers to Frec Markets, Inc., and its wholly owned subsidiaries, Frec Securities LLC and Frec Advisers LLC. Read about the services and differences between the entities in our Form CRS.

Product images are for illustrative purposes only.

FREC © 2026 Frec Markets, Inc.
All rights reserved.